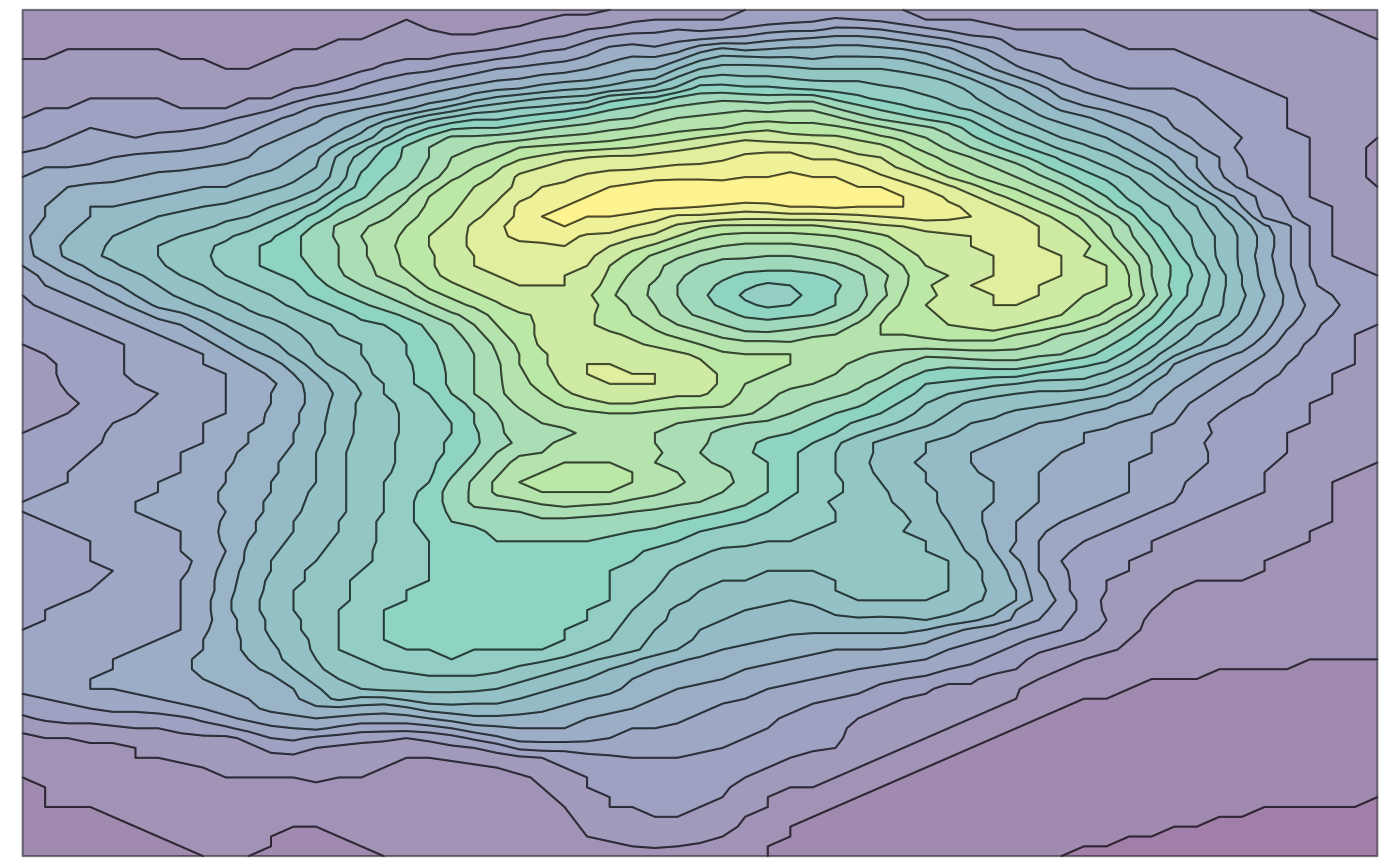
This function generates a grid grob that represents isobands.
Usage
isobands_grob(bands, gp = gpar(), units = "npc")Arguments
- bands
Isobands, as produced by the
isobands()function.- gp
Grid graphical parameters. Parameters are recycled among the total number of bands drawn.
- units
A character string specifying the units in which to interpret the isobands coordinates. Defaults to
"npc".
See also
See isolines_grob() for drawing of isolines.
Examples
library(grid)

viridis_pal <- colorRampPalette(
  c("#440154", "#414487", "#2A788E", "#22A884", "#7AD151", "#FDE725"),
  space = "Lab"
)

x <- (1:ncol(volcano))/(ncol(volcano)+1)
y <- (nrow(volcano):1)/(nrow(volcano)+1)
bands <- isobands(x, y, volcano, 5*(18:38), 5*(19:39))

b <- isobands_grob(
  bands,
  gp = gpar(col = "black", fill = viridis_pal(21), alpha = 0.5)
)

grid.newpage()
grid.draw(b)