This function generates a grid grob that represents labeled isolines.
Usage
isolines_grob(
  lines,
  gp = gpar(),
  breaks = NULL,
  labels = NULL,
  margin = unit(c(1, 1, 1, 1), "pt"),
  label_col = NULL,
  label_alpha = NULL,
  label_placer = label_placer_minmax(),
  units = "npc"
)
Arguments
- lines
Isolines, as produced by the
isolines()function.- gp
Grid graphical parameters. Parameters applying to lines (such as
col,lwd,lty, etc.) are recycled among the total number of lines drawn. Parameters applying only to labels (such asfontfamily,fontsize) are recycled among the specified breaks only. The two parameterscolandalphaare also applied to labels, unless overridden (seelabel_colandlabel_alpha), but are matched to the corresponding lines.- breaks
Character vector specifying the isolines that should be labeled. If
NULL, labels all isolines.- labels
Character vector specifying the labels for each break. If
NULL, uses the breaks as labels. The number of labels provided must match the number of breaks provided.- margin
Unit object of length 4 specifying the top, right, bottom, and left margins around each text label. The same margins are applied to all labels.
- label_col
Color applied to labels. Can be used to override the color provided in
gp, in case labels and lines should have different colors.- label_alpha
Alpha applied to labels. Can be used to override the alpha value provided in
gp, in case labels and lines should have different alpha values.- label_placer
Function that controls how labels are placed along the isolines. Uses
label_placer_minmax()by default.- units
A character string specifying the units in which to interpret the isolines coordinates. Defaults to
"npc".
See also
See isobands_grob() for drawing of isobands. See label_placer_minmax() for
label placement strategies.
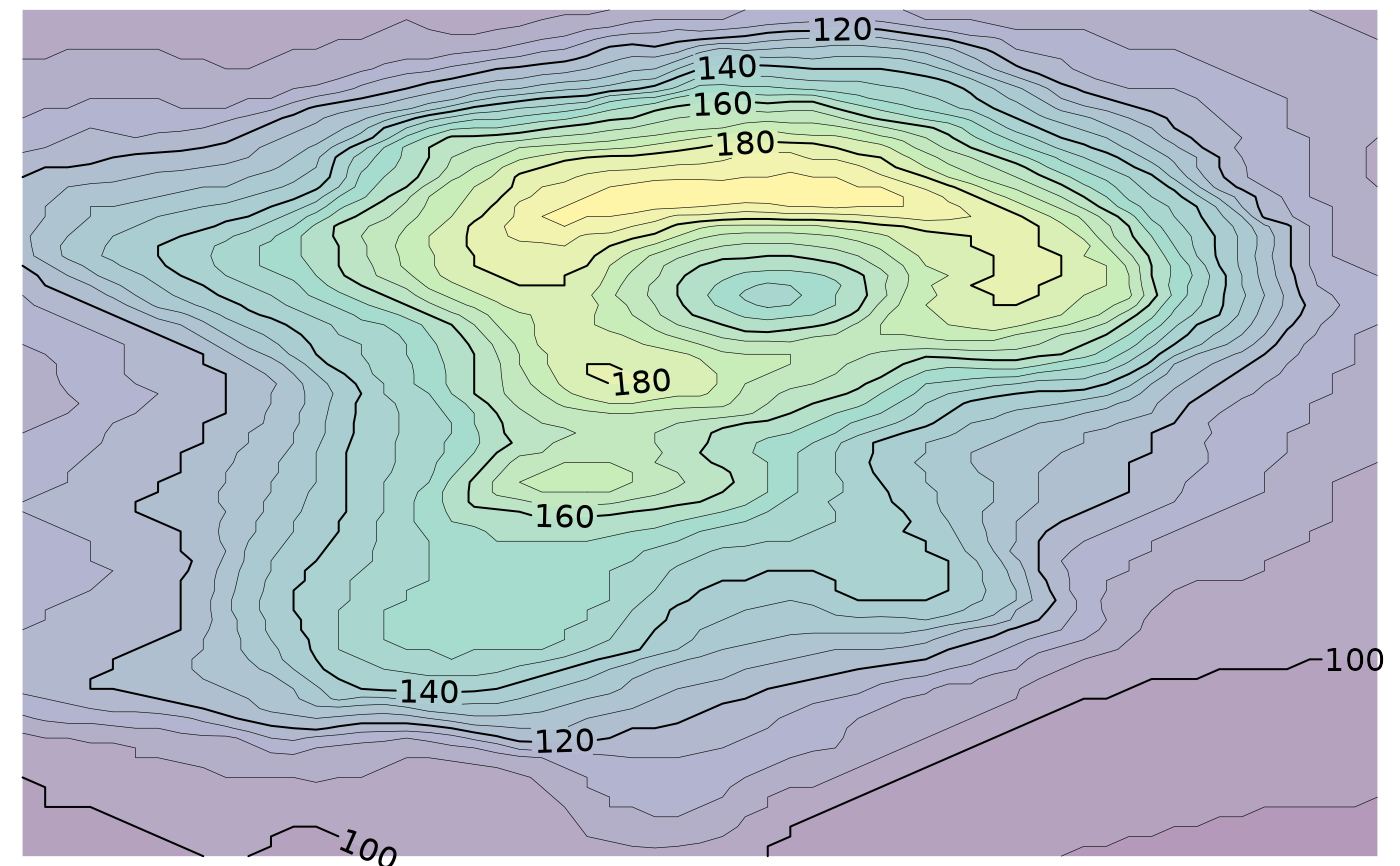
Examples
library(grid)

viridis_pal <- colorRampPalette(
  c("#440154", "#414487", "#2A788E", "#22A884", "#7AD151", "#FDE725"),
  space = "Lab"
)

x <- (1:ncol(volcano))/(ncol(volcano)+1)
y <- (nrow(volcano):1)/(nrow(volcano)+1)
lines <- isolines(x, y, volcano, 5*(19:38))
bands <- isobands(x, y, volcano, 5*(18:38), 5*(19:39))

b <- isobands_grob(
  bands,
  gp = gpar(col = NA, fill = viridis_pal(21), alpha = 0.4)
)
l <- isolines_grob(
  lines, breaks = 20*(5:10),
  gp = gpar(
    lwd = c(.3, 1, .3, .3)
  )
)

grid.newpage()
grid.draw(b)
grid.draw(l)